ARCH 655 Algorithms and Scripting for Parametric Design ( Project 2)
Soundscape ParkMiami Beach, Florida


Ladybug
Ladybug is an open-source environmental plugin for Grasshopper3D that helps architects and engineers create an environmentally-conscious architectural design. Ladybug imports standard EnergyPlus Weather files (.EPW) into Grasshopper and provides a variety of 3D interactive graphics to support the decision-making process during the initial stages of design.
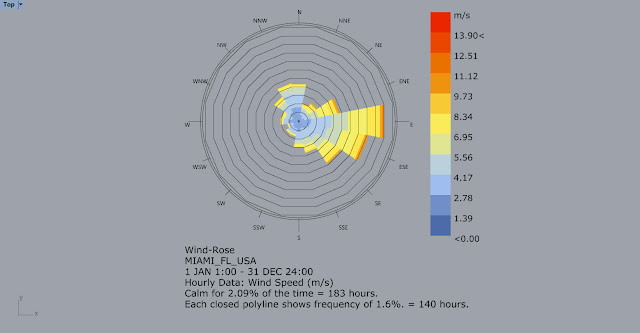
1. Wind rose analysis
In order to make a circular shape diagram to show wind speed and wind direction. I downloaded epw file from https://www.energy.gov/eere/downloads/archive-reference-buildings-climate-zone-1a-miami-florida. Because Soundscape Park is located in Miami, I downloaded the Miami epw file.
Import epw file, connect ' wind speed' to ' wind speed', ' wind direction' to 'wind direction'.
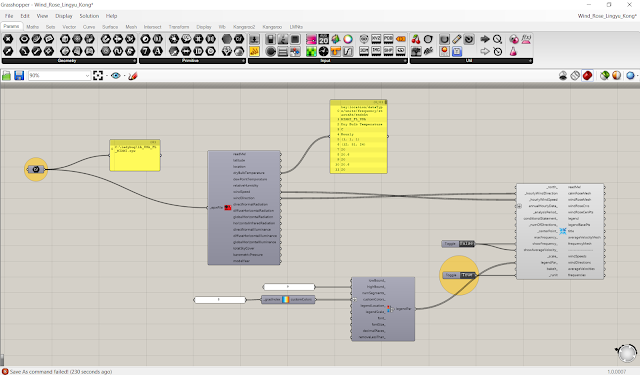 Double click ' Boolean Toggle'.
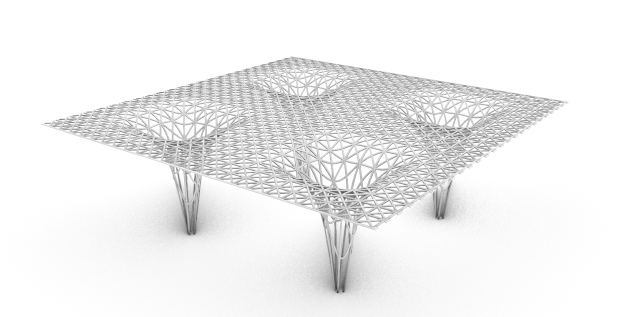
2. Shadow range analysisI used the baked model that I made in project 1, and convert the mesh to surfaces.

Import epw file and brep. Set parameters for ' hour, data and month '. Double click ' Boolean Toggle'.


Import epw file. Connect temperature and humidity to ' Ladybug 3D Chart '.


In order to make a circular shape diagram to show wind speed and wind direction. I downloaded epw file from https://www.energy.gov/eere/downloads/archive-reference-buildings-climate-zone-1a-miami-florida. Because Soundscape Park is located in Miami, I downloaded the Miami epw file.
Import epw file, connect ' wind speed' to ' wind speed', ' wind direction' to 'wind direction'.
 Double click ' Boolean Toggle'.
2. Shadow range analysisI used the baked model that I made in project 1, and convert the mesh to surfaces.


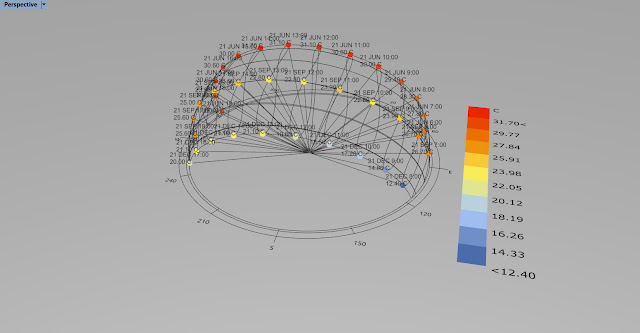
3. Weather data analysis


4. Mapping annual data on sun pathImport epw file and brep. Set parameters for ' hour, data and month '.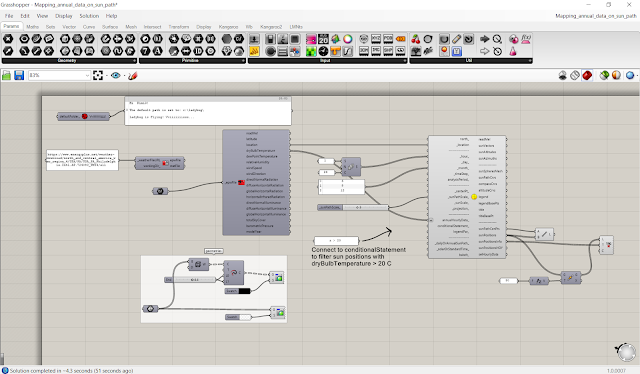


Comments
Post a Comment